How Does the Prioritization Plan Work?
The Prioritization Plan balances three key factors:
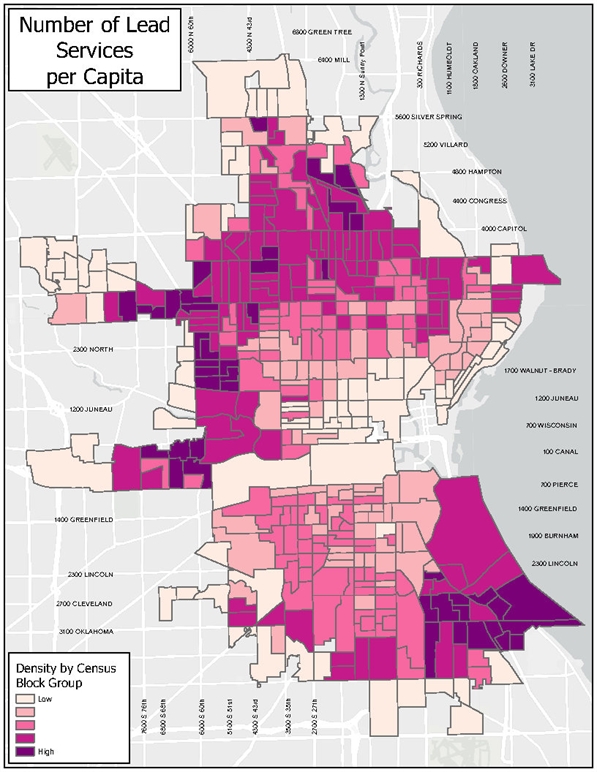
- Density of lead service lines,
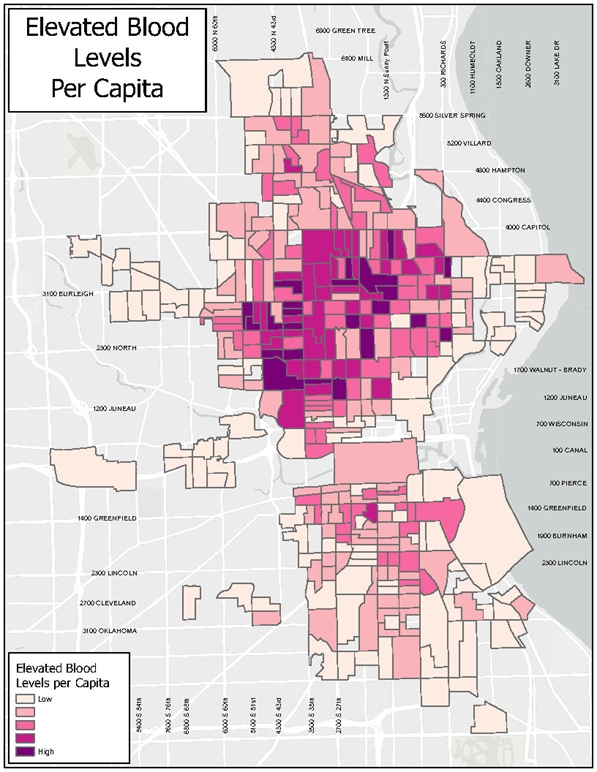
- Incidences of elevated blood lead levels (EBLL) in children
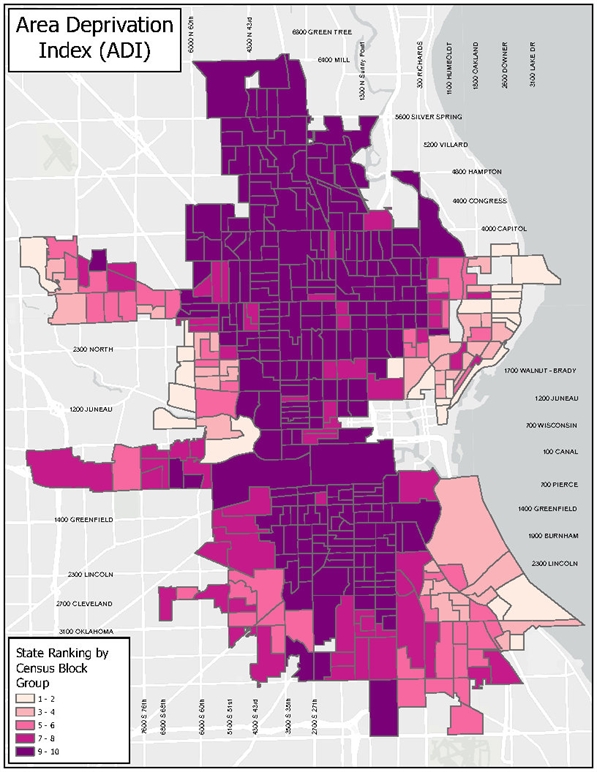
- The neighborhood’s score on the ADI (Area Deprivation Index)
Each Census Block Group in Milwaukee is assigned a score based on these factors. The criteria are weighed as follows:
- ADI score: 70%
- EBLL incidence: 25%
- Lead service line density: 5%
These scores are recalculated each year to reflect updated data, including population shifts, new lead testing results, and ongoing service line replacements.
How Many Lead Service Lines Will Be Replaced Annually?
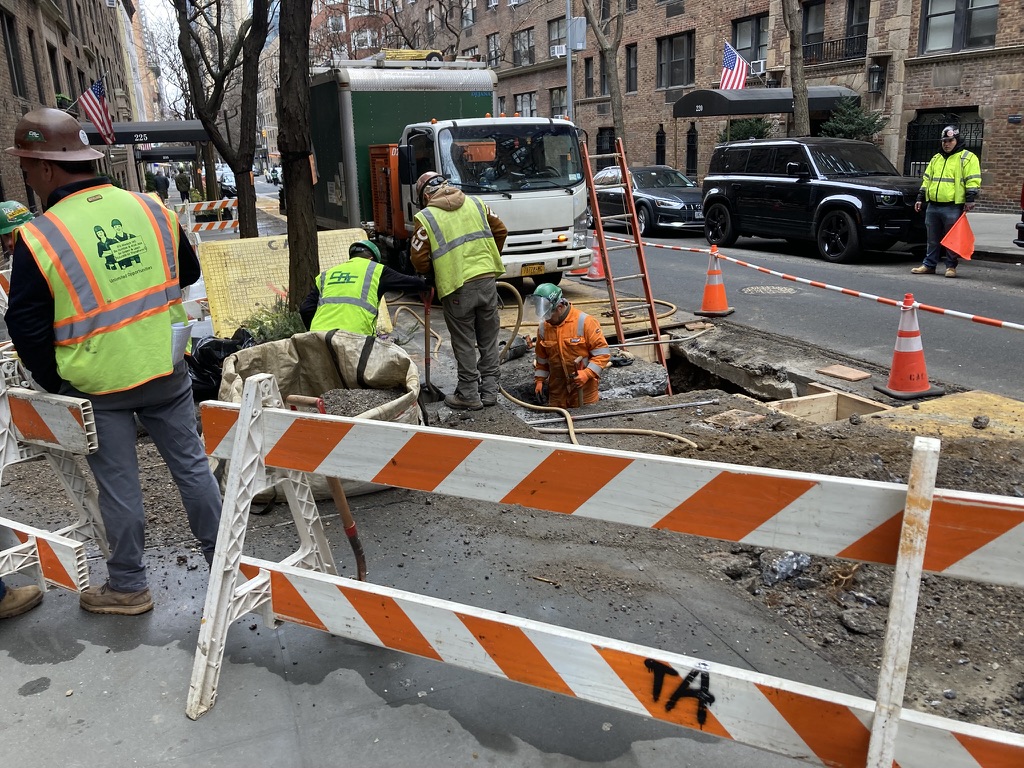
Most of Milwaukee’s remaining lead service lines will be replaced under the Prioritization Plan. In 2025, Milwaukee will replace 3,500 lead service lines as part of this plan, in addition to the replacements under the base plan (which includes water main and city paving projects, childcare facilities, and leaks).
This is the second year of implementing this prioritization process, and the number of replacements will increase each year.
How Are Neighborhoods Selected?
Once all Census Block Groups receive a score from 0-1,000, they are ranked in order of priority.
Since the highest-ranking areas are 60% on the North Side and 40% on the South Side, MWW will conduct 60% of replacements on the North Side and 40% on the South Side each year to maintain a balanced replacement approach across the city.
Will my lead service line be replaced under the Prioritization Plan?
Property owners and residents can check if their address is scheduled for replacement in the current year by visiting the interactive mapping site.
MWW recalculates the Census Block scores each year. As people move in and out of neighborhoods, the population changes, which affects the prioritization scores. As primary care providers test children for lead, the number of test results showing EBLLs also changes. The ADI score updates every two years when the U.S. Census Bureau conducts the American Community Survey. As lead service lines are replaced, the overall density of these lines in Milwaukee will decrease.
Data Used for Prioritization
Density of Lead Service Lines
Milwaukee Water Works maintains an inventory of lead service lines. We use this data to determine lead service line density.
Elevated Blood Lead Levels
Area Deprivation Index
The index used by Water Works is called the Area Deprivation Index (ADI), developed by the UW School of Medicine and Public Health’s Center for Health Disparities.
The ADI combines 17 different criteria
The criteria relate to income, employment, housing, education, and other household factors.
It was designd to inform healthcare delivery and health-related policy.
The data for the ADI comes from the American Community Survey, which is conducted by the U.S. Census Bureau.